To make this possible, you must have the point data and my point data I used to do a graph is shown below:-

<script src='http://onlinebiztutorials.googlepages.com/wz_jsgraphics.js' type='text/javascript'/>
<script src='http://onlinebiztutorials.googlepages.com/pie.js' type='text/javascript'/>
Save the template. Now moving forward on your post editor which is under Edit Html mode. Copy and paste this script into your post editor as shown below:-
<div id="pieCanvas" style="overflow: auto; position:relative;height:350px;width:380px;"></div>
<script type="text/javascript">
var p = new pie();
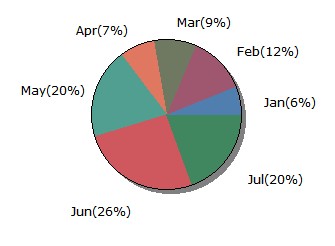
p.add("Jan",100);
p.add("Feb",200);
p.add("Mar",150);
p.add("Apr",120);
p.add("May",315);
p.add("Jun",415);
p.add("Jul",315);
p.render("pieCanvas", "Pie Graph")
</script>
1 comments:
I'd like to personally apologize for the downing of JavaScriptHost
Post a Comment
1. Comments posted must be accompanied by names or pseudonyms.
2. Anonymous posting and those containing profanities will be rejected.
3. Comments are moderated due to spam problems. I have to approve the comment before it will show up.